The (Hashtag) Organization of Oil-Trading Tweeters (#OOTT) June 2016 Newsletter
2016-06-29
Welcome to our second monthly #OOTT newsletter!
Wow! We’re making great progress! The #OOTT as a hashtag has just taken off to new heights as journalists, traders, researchers, enthusiasts and oil professionals contribute their latest news and views in regards to the world of oil!
Let’s summarize some of the advancements we have made over the past month in terms of the #OOTT infrastructure:
#OOTT Tanker Tracking workbook has been sharply improved!
- A lot more ports are now being tracked in the US PADD regions 1 (East Coast), 3 (Gulf of Mexico) and 5 (West Coast). We don’t have 100%, but it seems like it’s above 80-85%. These insights give us at least an idea of what EIA inventory reports might reveal in terms of a build/draw in inventory.
- We have completed a MAMMOTH task of logging 225 tankers across 6 ports in China! Check it out: https://twitter.com/Lisa_Ward1990/status/747919641910087681
- Our Weekly #OOTT Tanker Count is showing us interesting weekly changes within the select hotspots we cover. These figures are updated each Wednesday noon (CET).
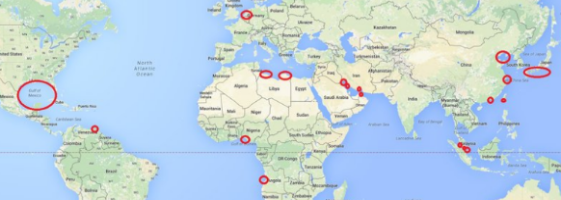
- Iran has become the 2016 hotspot to watch as the country has come out of economic sanctions, though still somewhat of an incomplete chapter. Earlier claims made in the media of a 47 million barrel presence in the Persian Gulf as “floating oil storage” are questionable as our own research (verified by two solid sources) claim that the actual number is currently less than 30 million barrels. You will find a frequently updated list of tankers along with a total figure in the #OOTT Tanker Tracking workbook. There is an “Iran” tab there.
- We have ambitions to track some other countries, such as Libya, Nigeria and Venezuela. These might not be on a regular basis, but every now and then won’t hurt! ;-)
- Our workbook’s tanker database is swelling quickly with more entries being made each week. There are approximately 1400 tankers in the list which have been (and continuously undergo) inspection for any faults in terms of weights and dimensions as those metrics can mess up the automated barrel calculations. If you spot any faults, please let us know!
- We have spawned a scaled down, clutter-free workbook for all of you #OOTT fans to enjoy! It’s called “My #OOTT Tanker Tracker”! From there, you must click on “File” on the top left, followed by “Make A Copy” in order to own one. After that, you can begin your own tanker tracking exercises! Go out there and keep track of a port or zoom in on a cluster of tankers awaiting port entry somewhere in the world! Add to your database by using the “Vessel Lookup” feature. If you have any new tankers we’re missing, please provide us a link to your workbook and we’ll copy them in! If we work together, we’ll get further ahead! Use www.marinetraffic.com to track tankers. All you have to do is select the Vessel Type on the left bar and select Tankers.
UPDATED (2016-06-30)
The Fuse magazine interviewed us about #OOTT, and put out this HUGE article as their cover story!!
http://energyfuse.org/organization-oil-trading-tweeters-merges-powerful-data-culture-openness/
PS: Please consider adding the #OOTT to your Twitter profile description so you can all find one another and expand your own contact networks.
ENJOY! :-)
#OOTT Custodians
@Samir_Madani
@Lisa_Ward1990
@kxviswan123
@HeidsterTrades
@WallstreetRage
@kthackeriah1
@Lee_Saks
@enmanagers
@SilverIce92
The (Hashtag) Organization of Oil-Trading Tweeters (#OOTT) May 2016 Newsletter
2016-05-30
Welcome to our very first monthly #OOTT newsletter!
We’re enjoying an exciting ride since our inception on the 29th of April this year. As a decentralized community of participants, we continue to meet several objectives:
- Educate one another about oil as a sector, commodity and market. It is encouraging to see people bring forth facts and figures (no matter how trivial) that are of interest to the rest of the community. It is often the small details that at some point end up taking center stage for a certain period of time, affecting the market in an unexpected way. Not only that, but most of us have very little insight as we do not work within the industry. The same can be said about most professional traders within our community. The world of oil is huge when you look at the networks of pipelines, tankers, storage facilities, companies running them and the countries they belong to. When it comes to total insight, the fact remains: nobody knows everything, but everyone knows something. Let’s bring all of that together by applying #OOTT to any tweets containing eye-opening information.
- Track the maritime flow of oil to our best ability. There are two main regions of interest which we are currently covering: USA vs Worldwide. Worldwide, we have just recently started keeping weekly records of tanker quantity in select ports & regions of interest. It is divided between top importing nations as well as key exporting nations where tankers are gathered in large clusters. These figures are updated each Wednesday, no later than noon CET. As for the USA, this is becoming a mammoth project and undertaking that probably hasn’t been fully attempted previously outside of companies which specialize in such services; albeit for a substantial premium. The objective of tracking tankers coming into the US is to get a feel for how the week prior to the API & EIA reports has been; whether the country took in too many/few barrels. Based on this, we would feel more comfortable with the decisions we take when determining which direction the oil price might go at time of report; particularly EIA.
- Network together instead of working independently. It’s a lot of fun! The “Batman signal” is #OOTT. Simply click on the hashtag in Twitter, and you’ll find a long list of others who share the same interest. Connect with one another, exchange news & views. #OOTT as a community has contributors from ALL over the world, working with so many different things even outside of the oil sector. This is not necessarily a negative, considering the complexion is composed of engineers, chemists, sailors, accountants, economists, sales executives, business leaders, journalists, as well as experienced oil traders.
Accomplished Milestones
We have put together several spreadsheet workbooks online via Google Docs. It allows contributors to work on different parts of each document at the same time while leaving the curtain open for the world to review in real-time. There are several custodians per workbook, living in different parts of the world in order to keep the information updated around the clock. The two key documents are:
- #OOTT Crude Oil Events – This workbook keeps a live journal of events happening in the world of oil. You can also get an overview of which events are coming up for the week. For each event of importance (i.e., anything that moves oil price substantially), the facts & figures are recorded, along with a link to the source (with timestamp) and possibly an analysis by the custodians of the workbook. This workbook also contains news and figures of any refinery outages in the USA.
- #OOTT Tanker Tracking – This workbook is an ambitious endeavor to keep track of maritime tankers that import oil into the United States. It is maintained daily by reviewing each vessel that docks at port in PADD (Petroleum Administration of Defense Districts) regions 1 (Atlantic Coast), 3 (Gulf of Mexico) and 5 (Pacific Coast). The document also contains a vessel list of key fleets as well as a Tracking Guide (instructional manual) and updated weather forecasts per PADD region.
As part of our development, we have evolved the document by introducing new a number of bells & whistles that speed up the process of retrieving all of the necessary dimension details per vessel when registering the IMO (International Maritime Organization) number into the database. The most important information we calculate (using an in-house formula) is the minimum & maximum depth of a vessel’s draft. A fully loaded oil tanker will have its draft submerged deep into the water (A VLCC/Very Large Crude Carrier goes up to 22.5 meters), and when empty will show a lower figure. As tracking sites such as www.marinetraffic.com offer information on draft depth and position in real-time, we are able to calculate how many barrels were brought into port as well as how many remained in port after the vessel departed. Not all arrivals are fully loaded, just as not all unloadings are complete either for that matter.
Additional resources
#OOTT Oil Supply & Demand – A very well detailed workbook containing tab sheets of figures in regards to oil storage and demand per market.
#OOTT Barrel Storage Size Calculator – This workbook works if you download it (File->Download As->Microsoft Excel (.xlsx)) to your computer first. From there, you can forward/reverse calculate the size of storage sites in order to figure out how many oil barrels they may be containing.
MarineTraffic.com – This is the website which helps us keep track of all the vessels we follow at various ports around the world. We are able to retrieve plenty of data both manually as well as “automagically” thanks to our spreadsheet macros. The site also has a mobile app which lets you apply vessel filters and search for specific tankers, fleets and ports. Their customer support has been very accommodating to requests by #OOTT, in particular the addition of LOOP (Louisiana Offshore Oil Port), which previously wasn’t available. LOOP is the only offshore oil port in the US which accepts VLCC’s (2.2M barrels) and ULCC’s (3.5M barrels). It also accounts for up to half of PADD3’s daily intake as it contains a 67M barrel storage capacity on the mainland; near New Orleans.
Clipperdata – This is an industry supplier of highly accurate maritime data, providing its paying customers updates and reports of oil flow worldwide as well as in the United States. Each workday, a new blogpost (sign up for it!) is made available by its author, Matt Smith (follow him!). The blogposts cover several different angles when explaining the reason for price being up/down during the day; everything from the physical oil to macroeconomics. These blogposts are extremely educational and reliable in their accuracy. The source is solid.
Periscope – We shall be using more of this service in the future in order to deliver a video broadcast of whatever topics we wish to discuss/present in deeper detail in front of a global audience. The service addresses current followers while also drawing in newer ones. Our first (and only for now) video was shot a few weeks ago.
In closing, #OOTT has no defined perimeter as it is an expanding universe of daily contributors. The simplest way to contribute is to post news, facts or figures with a #OOTT hashtag in the tweet. A more favorable way to contribute is by reaching out to various workbook custodians and offer to assist with things such as tanker tracking or logging news/events. If you have other documents/workbooks you’re working on, then bring them to our attention and we’ll promote it! WE WELCOME MORE CUSTODIANS AT ANY TIME, so feel free to get in touch!
PS: Please consider adding the #OOTT to your Twitter profile description so you can all find one another and expand your own contact networks.
Many thanks!
#OOTT Custodians